- Home
-
About us

MIET Kumaon is a reputed engineering and management institute in Uttarakhand, offering quality education, modern infrastructure, experienced faculty, and industry-focused programs to nurture future-ready professionals in various technical disciplines.
Read more -
Admissions

Learn software development, programming, and IT skills to build a strong foundation for a career in technology
Read more
Gain essential knowledge in management, marketing, and finance to prepare for leadership roles in the corporate world.
Read more
Develop clinical skills to diagnose, treat, and rehabilitate patients through physical therapy and therapeutic exercises.
Read more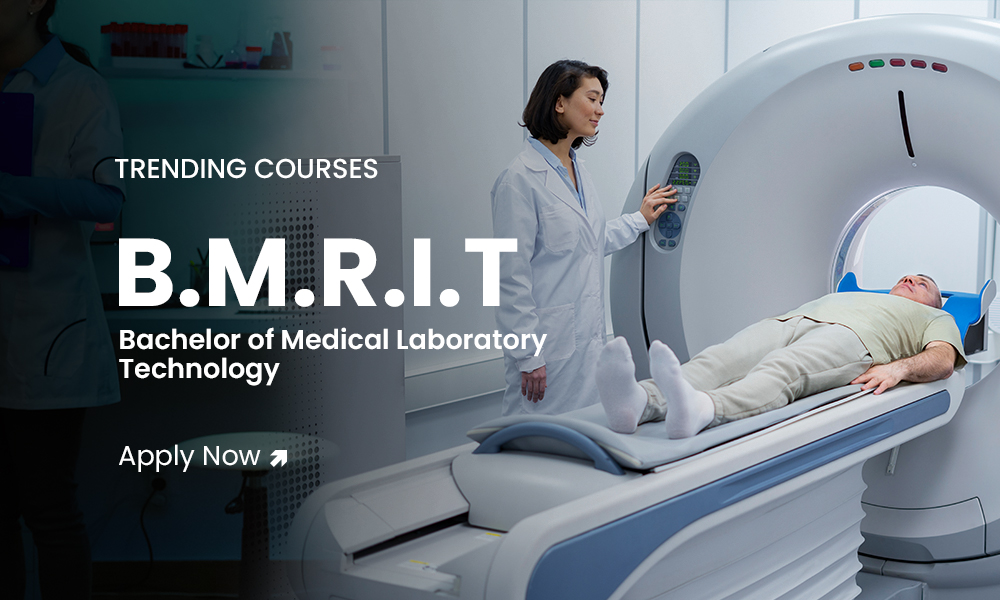
Train in radiographic techniques, imaging equipment, and diagnostic procedures for a career in medical imaging technology.
Read more
Master laboratory techniques, diagnostics, and medical testing to support accurate disease detection and patient care.
Read more
Learn nursing care, midwifery, and patient management for a career in hospitals and healthcare centers.
Read more
Comprehensive training in patient care, clinical skills, and medical knowledge for a rewarding nursing profession.
Read more -
Colleges

Build a rewarding career with us at MIET Kumaon, where innovation, growth, and excellence drive our mission. Join a dynamic team committed to shaping future leaders and professionals.
Career With UsManagement & Computer Application
College of Nursing
College of Paramedical Science
-
Campus Life

"Explore the vibrant campus life of MIET Kumaon through our View Gallery. Witness state-of-the-art infrastructure, engaging student activities, workshops, seminars, and memorable cultural events. Our gallery captures the essence of academic excellence, innovation, and holistic development that define the MIET experience. Take a virtual tour and feel the energy that drives our institution forward."
View Gallery -
Highlights

"Stay updated with the latest campus news, educational insights, student stories, and expert articles through our college blog—your gateway to knowledge, inspiration, and life at MIET Kumaon."
View Our Blog - Career
- Contact us
- Blog

Home
About Us
- About Us
- Chairman
- Managing Director
- Director
- Vision & Mission
- Courses Offered by MIET
- Grievance
- AICTE Approval
Admissions
Management & Computer Applications
College of Nursing
College of Paramedical Science
Campus Life
- All Courses
- Admissions
- Student testimonials
- Placement
- Student Profile
- Proctorial Board
- Rules & Regulations
- Anti-Ragging Squad
- Fee Payment
- Well Stocked Library
- Wifi Campus
- Transport
- Hostel
- Medical
- Hygienic Cafeteria
- Sports Complex
Highlights
- Achivements
- Research & Development
- Industrial Interface
- Admissions Cell
- Online Registration
- Documents Required
- Innovation